Co-Authored. This document provides guidelines for deployment and configuration on how to back up and protect ESXi VMs on XC Series platforms with data protection Dell EMC Avamar and DataDomain products.
Monday, May 8, 2017
Avamar and Data Domain on Hyper-V using Dell EMC XC Series Hyper-Converged Appliances Deployment Guide
Co-Authored. This document provides guidelines for deployment and configuration on how to back up and protect Microsoft Hyper-V VMs on XC Series platforms with data protection Dell EMC Avamar and DataDomain products.
Pivotal Cloud Foundry on VMware vSphere using Dell EMC XC Series Hyper-Converged Appliances Deployment Guide
This guide details the necessary steps to deploy and configure Pivotal Cloud Foundry (PCF) in a VMware vSphere environment on a standard configuration using XC Series appliances. Combining Pivotal Cloud Foundry with Dell EMC XC Series Hyper-converged appliance with vSphere, enterprises can create a full-featured, tightly integrated cloud platform based on open technologies. This guide should be used for lab environments.
Monday, October 24, 2016
Microsoft WS-Management and SMASH Discovery Template
*Update* Looks like Microsoft reposted the download. Here is the link: https://www.microsoft.com/en-us/download/details.aspx?id=29266
Looks like Microsoft has taken down the link for the WS-Management and SMASH Discovery Template. Not sure why yet. But if you still need it, I am posting it here until we figure out why it is gone from their site.
WS-Management and SMASH Discovery Template
WS-Management and SMASH Discovery Template
Friday, August 5, 2016
Quick Troubleshooting for Agent-Free Dell Devices in SCOM
First, if you know anything about SCOM, it is probably that almost nothing is quick. But here are the steps you need to take when needing to remove and re-add an Agent-Free device, or when you just can't get a device to be discovered Agent-Free to begin with.
Agent-Free monitoring in SCOM is available for 12G and later servers.
The rest of this post assumes that you have already been through my post on setting up Agent-Free and SNMP Monitoring (http://bradsjumpbag.blogspot.com/2015/12/dell-server-management-pack-with-agent.html) for initial setup. If you are still having problems and cannot get the iDracs discovered through the WSman template, here are some troubleshooting steps.
1. If an iDrac is already discovered and in SCOM, it cannot be discovered again. If it is already an Agent-Managed device or discovered as an SNMP device, it cannot be discovered again. You must remove it from the console first. Do a quick search for the machine in the top left Search box in SCOM. If it shows up in the results, then it is certainly in the console and will need to be removed.

Find it and delete it. The results may tell you where it is. Otherwise, look for it in some of these common places:
On the Administration workspace, look under Agent Managed, Agentless Managed, Pending Management, Network Devices, Network Devices Pending Management.
On the Authoring Node, go to WS-Management and SMASH Device Discovery, open the properties of the first template and make sure the iDrac is not on listed on the Devices tab. Repeat this for each template.
If you find the iDrac on any of these views, please delete it.
2. If the machine is a Windows server, login to it and look in Control Panel\Programs and Features. Make sure that the Microsoft Monitoring Agent is not installed. If it is, please uninstall it. Having this installed will cause the machine to keep trying to re-insert itself into the SCOM DB.
3. Make sure the machine is removed from the WS-Management and SMASH Device Discovery templates. Once you remove it here, SCOM should start the clean up process. There is a SMASH device script from Microsoft that is supposed to run. However, you can kickoff this script yourself too to make sure that it starts.
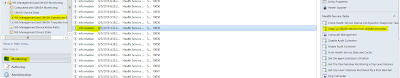
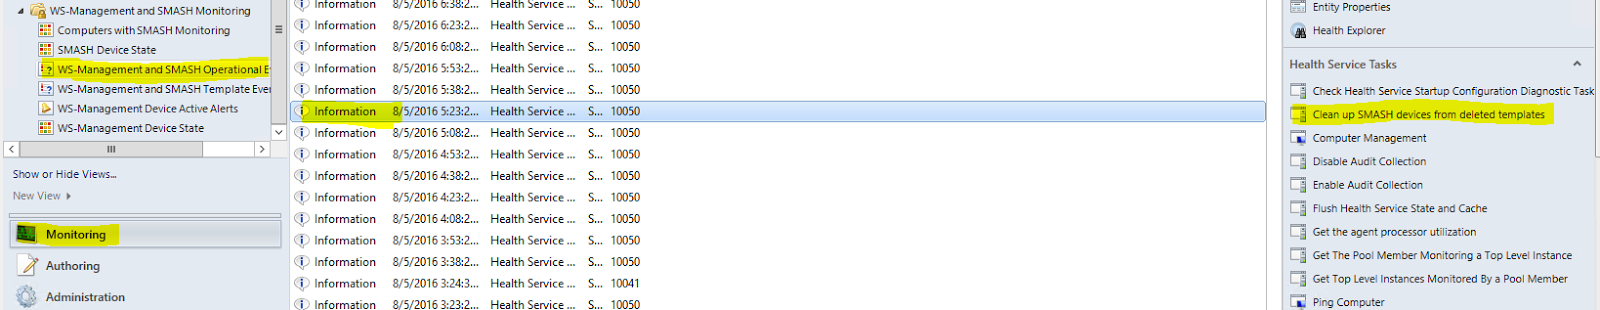
Go to the Monitoring workspace, scroll all the way to the bottom and expand WS-Management and SMASH Monitoring. Click on WS-Management and SMASH Operational Events. Click on any event to highlight it. Then you will be able to find and click on the "Clean up SMASH devices from deleted templates" script in the Tasks pane on the far right.
4. After you have deleted the target device, uninstalled any Microsoft Monitoring Agent, and run the SMASH clean up script, now it is time to wait a little while. I usually suggest giving it an hour.
5. Next, let's check the SQL DB. Open SQL Management Studio and connect to the Operations Manager DB. Select New Query from the toolbar. If you are looking for several machines, you can use this query:
SELECT * FROM dbo.[BasemanagedEntity] where FullName Like '%Windows.Computer%'
If you are looking for a specific machine, use this query and replace FQDN with your machine name:
SELECT * FROM dbo.[BasemanagedEntity] where FullName Like '%Windows.Computer%' and Name Like 'FQDN'
***NOTE*** If you copy and paste the query instead of typing it, you might need to replace the apostrophes. Just delete them and then replace from your keyboard.
In the results tab, scroll over looking for the IsDeleted column. If the machine(s) you are concerned with have a 0 in that column, we need to change them with an update query.

Use this Update query and replace FQDN with the specific machine that needs to be changed:
UPDATE dbo.[BasemanagedEntity] SET IsDeleted = 1 where FullName Like '%Windows.Computer%' and Name Like 'FQDN'
Give the system a little more time. I have not timed this so I don't know how long to suggest.
6. Now the target device should be gone from the DB and Operations Manager console. We should be able to discover it now. If you already have a WS-Management and SMASH Device Discovery template, you can add the target iDrac IP back into the into the device list. Or you can refer back to my post on setting up Agent-Free and SNMP Monitoring (http://bradsjumpbag.blogspot.com/2015/12/dell-server-management-pack-with-agent.html). Step 12 in section 1.3 is where we start creating the template.
Now give it a little more time for the discovery, inventory and correlation scripts to run. Once the iDrac shows up in the Servers and WRack orkstations (Agent-Free) view, you can discover them as SNMP devices. Those steps are in the other post as well.
I hope this helps you discover or re-discover your Dell Agent-Free devices.
Agent-Free monitoring in SCOM is available for 12G and later servers.
The rest of this post assumes that you have already been through my post on setting up Agent-Free and SNMP Monitoring (http://bradsjumpbag.blogspot.com/2015/12/dell-server-management-pack-with-agent.html) for initial setup. If you are still having problems and cannot get the iDracs discovered through the WSman template, here are some troubleshooting steps.
1. If an iDrac is already discovered and in SCOM, it cannot be discovered again. If it is already an Agent-Managed device or discovered as an SNMP device, it cannot be discovered again. You must remove it from the console first. Do a quick search for the machine in the top left Search box in SCOM. If it shows up in the results, then it is certainly in the console and will need to be removed.
Find it and delete it. The results may tell you where it is. Otherwise, look for it in some of these common places:
On the Administration workspace, look under Agent Managed, Agentless Managed, Pending Management, Network Devices, Network Devices Pending Management.
On the Authoring Node, go to WS-Management and SMASH Device Discovery, open the properties of the first template and make sure the iDrac is not on listed on the Devices tab. Repeat this for each template.
If you find the iDrac on any of these views, please delete it.
2. If the machine is a Windows server, login to it and look in Control Panel\Programs and Features. Make sure that the Microsoft Monitoring Agent is not installed. If it is, please uninstall it. Having this installed will cause the machine to keep trying to re-insert itself into the SCOM DB.
3. Make sure the machine is removed from the WS-Management and SMASH Device Discovery templates. Once you remove it here, SCOM should start the clean up process. There is a SMASH device script from Microsoft that is supposed to run. However, you can kickoff this script yourself too to make sure that it starts.
Go to the Monitoring workspace, scroll all the way to the bottom and expand WS-Management and SMASH Monitoring. Click on WS-Management and SMASH Operational Events. Click on any event to highlight it. Then you will be able to find and click on the "Clean up SMASH devices from deleted templates" script in the Tasks pane on the far right.
4. After you have deleted the target device, uninstalled any Microsoft Monitoring Agent, and run the SMASH clean up script, now it is time to wait a little while. I usually suggest giving it an hour.
5. Next, let's check the SQL DB. Open SQL Management Studio and connect to the Operations Manager DB. Select New Query from the toolbar. If you are looking for several machines, you can use this query:
SELECT * FROM dbo.[BasemanagedEntity] where FullName Like '%Windows.Computer%'
If you are looking for a specific machine, use this query and replace FQDN with your machine name:
SELECT * FROM dbo.[BasemanagedEntity] where FullName Like '%Windows.Computer%' and Name Like 'FQDN'
***NOTE*** If you copy and paste the query instead of typing it, you might need to replace the apostrophes. Just delete them and then replace from your keyboard.
In the results tab, scroll over looking for the IsDeleted column. If the machine(s) you are concerned with have a 0 in that column, we need to change them with an update query.

Use this Update query and replace FQDN with the specific machine that needs to be changed:
UPDATE dbo.[BasemanagedEntity] SET IsDeleted = 1 where FullName Like '%Windows.Computer%' and Name Like 'FQDN'
Give the system a little more time. I have not timed this so I don't know how long to suggest.
6. Now the target device should be gone from the DB and Operations Manager console. We should be able to discover it now. If you already have a WS-Management and SMASH Device Discovery template, you can add the target iDrac IP back into the into the device list. Or you can refer back to my post on setting up Agent-Free and SNMP Monitoring (http://bradsjumpbag.blogspot.com/2015/12/dell-server-management-pack-with-agent.html). Step 12 in section 1.3 is where we start creating the template.
Now give it a little more time for the discovery, inventory and correlation scripts to run. Once the iDrac shows up in the Servers and WRack orkstations (Agent-Free) view, you can discover them as SNMP devices. Those steps are in the other post as well.
I hope this helps you discover or re-discover your Dell Agent-Free devices.
Thursday, August 4, 2016
Dell MP Suite 6.2 CMC Class not Found errors
Dell Management Pack Suite 6.2 has simplified discovery and monitoring for CMCs. Chassis Detailed discovery and Slot discovery now do not require the RACADM utility. The RACADM utility is only required to monitor the health of the Chassis controller, IO Module, IO Module Group, Power Supply, and Power Supply Group.
This simplification has included adding WSman status plus inventory polling for CMCs to the basic script that runs against all VRTX, M1000e, and FX2 chassis.
There are a couple of classes that are available on VRTX but not M1000e or FX2. If you happen to have Log Level overridden to 1 (enabled), you will see 2 errors every day on each M1000e and FX2 CMC log. By default, these logs are at C:\Windows\Temp\DellDeviceHelper_Logs when enabled.
The logs will be named with this format: DellDeviceHelper_X_X_X_X_GUID.log. The X_X_X_X will be the IP of your CMC. The logs are short and you can look through them for references to
"Profile Name= cimv2/DCIM_ChassisPCIDeviceView" or "Profile Name= cimv2/DCIM_ControllerView"
Then on the "Session Error" line you will see "Class not found ".
These errors are innocuous and can be ignored for M1000e and FX2 chassis. The only way to get rid of them is to disable the debug logging. This is considered working by design.
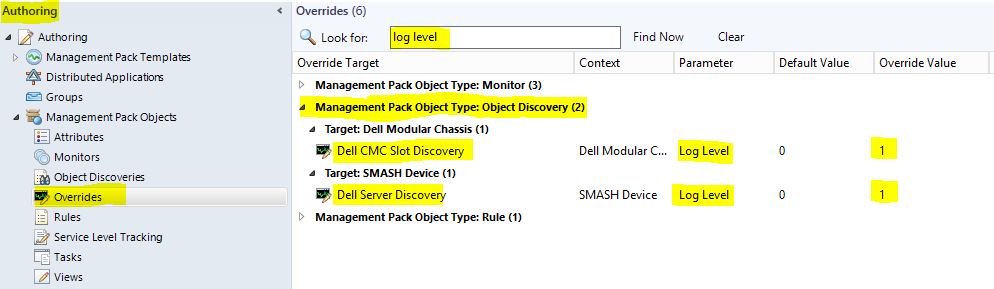
To turn off debug logging, go to the Authoring workspace, expand Management Pack Objects and select Overrides. Make sure the Find button is depressed in the toolbar and then in the Look for box type "log level" without the quotes, and click the Find Now button. Then expand Management Pack Object Type: Object Discovery and any Targets under that to locate the Log Level overrides.
I have highlighted in the picture below where I have 2 log levels set to 1.

You can either right click on each one and select Delete.

Or, you can double click on the target to open the properties and simply uncheck Log Level and click on OK.

Remove all Log Level set to 1 because they are not necessary unless you are debugging.
This simplification has included adding WSman status plus inventory polling for CMCs to the basic script that runs against all VRTX, M1000e, and FX2 chassis.
There are a couple of classes that are available on VRTX but not M1000e or FX2. If you happen to have Log Level overridden to 1 (enabled), you will see 2 errors every day on each M1000e and FX2 CMC log. By default, these logs are at C:\Windows\Temp\DellDeviceHelper_Logs when enabled.
The logs will be named with this format: DellDeviceHelper_X_X_X_X_GUID.log. The X_X_X_X will be the IP of your CMC. The logs are short and you can look through them for references to
"Profile Name= cimv2/DCIM_ChassisPCIDeviceView" or "Profile Name= cimv2/DCIM_ControllerView"
Then on the "Session Error" line you will see "
These errors are innocuous and can be ignored for M1000e and FX2 chassis. The only way to get rid of them is to disable the debug logging. This is considered working by design.
To turn off debug logging, go to the Authoring workspace, expand Management Pack Objects and select Overrides. Make sure the Find button is depressed in the toolbar and then in the Look for box type "log level" without the quotes, and click the Find Now button. Then expand Management Pack Object Type: Object Discovery and any Targets under that to locate the Log Level overrides.
I have highlighted in the picture below where I have 2 log levels set to 1.
You can either right click on each one and select Delete.
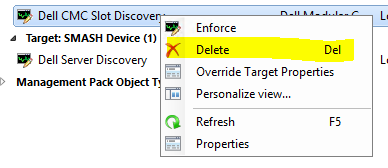
Or, you can double click on the target to open the properties and simply uncheck Log Level and click on OK.

Remove all Log Level set to 1 because they are not necessary unless you are debugging.
Friday, June 24, 2016
How to setup all of your iDrac6s for SNMP alerting
I first did this post for iDrac7s at the this link (http://bradsjumpbag.blogspot.com/2016/03/how-to-setup-all-of-your-idracs-for.html). Below I will show how to do the same thing for iDrac6s using firmware 1.99.
Please remember when setting your SNMP Community String that it is Case Sensitive. That means that "public" is not the same as "Public".
Let's start with logging into a single iDrac. Open a browser window and go to the IP of your iDrac6s. Login with your credentials or the default ones if you haven't changed them. Which you should change the default credentials or disable them and add new accounts for security reasons. You should also have all iDracs on a separate management network that is not accessible from the Internet. If you need to get to them from external, I suggest you setup some machine that you can remote into and then access that management network from there, or setup a highly secure gateway or VPN that will give you access to that management network.

Go to Alerts. The first thing you want to set is to make sure Platform Event Filter Alerts are Enabled. Then look at the Generate Alert column and make sure all of these are checked. They are checked by default, so the only way they should not be checked is if someone unchecked them. Now scroll to the bottom of the page and click on the Apply button on the far right.

Click on the Trap Settings tab at the top.. On this page you will need to enable Destination1 with the check box and enter in the destination server IP address. Since I am setting this up for OpsMgr, I will put in the IP of my OpsMgr server. If you are using a community string other than "public", put it in the Community String field. Then click on the Apply button at the bottom right of the page.

There is one more place to check your community string. Go to iDrac Settings on the left side. Click on Network/Security tab, and then the Services sub-tab at the top. Scroll down to find SNMP Agent box. Make sure the check box is checked so it is enabled and enter your community string here. Then click the Apply button at the very bottom of the page.

Now, if you have your destination server (in my case OpsMgr) setup already, you should start receiving traps. You can test this with the SNMP Test Trap button back on the Alerts\Trap Settings page. Click the Send button under Test SNMP Trap in the same row as the destination server you want to send to.

In OpsMgr you will see an informational alert like these. These alerts could show up in Active Alerts and Server and Rack Workstation Alerts, RemoteAccess Alerts, or PET Traps depending on the iDrac version and firmware version. They will all be Informational Alerts but should have the word Test in the Name.

Now that we know that 1 iDrac works, we need to copy these settings to all the others. You will need a machine with access to the management network of all of your iDracs. That machine will need the Dell DRAC Tools installed. The current latest version, as of 6/24/2016, is 8.3 and here are the link for the 64bit version.
64bit - http://www.dell.com/support/home/us/en/04/Drivers/DriversDetails?driverId=6RWMR
You will also need a text file with all of your iDrac6 IPs, each listed on a separate line.
The next step is to grab a copy of the config of the iDrac that you just set in the above steps. On your machine with access to your iDrac network, and with the DRAC Tools installed, you are going to run the following command from an Administrative level command prompt.
**NOTE**: These racadm commands below are for iDrac6 running 1.99. Different firmware may have different commands that you will need to look up in the iDrac CLI manuals if the below do not work.
racadm -r IPofTheIDrac -u Username -p Password getconfig -f LocationForTxtFile
Replace IPofTheIDrac with the IP of the iDrac you configured above.
Replace Username with your iDrac username.
Replace Password with your iDrac password.
Replace LocationForTxtFile with a path to where you want the configuration text file created. I put the config file in the same location as my iDracs.txt file with all of my iDrac IPs just to keep them together. In this example I put both in a folder c:\idrac.

Now we need to edit that config.txt file. Open it with your favorite text editor. You can use this file to make changes to all of your iDracs with the same firmware. As you scroll through you may see other sections you want to make changes to if you didn't do it in the GUI. But for this post I am only focusing on SMNP settings. So we are going to remove everything else in the config.txt file.
The other sections we are going to keep are [cfgOobSnmp], [cfgIpmiLan], [cfgIpmiPet] sections. There are 4 cfgIpmiPet sections, each with a different Index, but I only set the first one so I am removing the others. You don't have to keep every setting under each section. Just the settings that we changed in the GUI.
Now save that file, maybe with a different name so that you can keep the original. I'm going to save mine as idrac6push.txt in the same folder.
Here is where we finally push the config to all iDracs. You will use a PowerShell script. Right click on the PowerShell icon on your taskbar and select Run ISE as Administrator. When it opens copy this script into the top window. You will need to replace Username and Password to your own.
$servers = Get-Content .\idracs.txt
$servers | foreach {
invoke-expression "racadm.exe -r $_ -u Username -p Password config -f c:\idrac\idrac6push.txt"
}

When you are ready, click on the green play button in the middle of the tool bar to start the script. The script will set the config on each iDrac one at a time. You will see output for each idrac like in my screenshot above showing those 3 sections we kept in the config file. You can scroll back through the results pane to see if there were any errors.
Congratulations, now all of your iDrac6 devices should have the same SNMP settings.
Please remember when setting your SNMP Community String that it is Case Sensitive. That means that "public" is not the same as "Public".
Let's start with logging into a single iDrac. Open a browser window and go to the IP of your iDrac6s. Login with your credentials or the default ones if you haven't changed them. Which you should change the default credentials or disable them and add new accounts for security reasons. You should also have all iDracs on a separate management network that is not accessible from the Internet. If you need to get to them from external, I suggest you setup some machine that you can remote into and then access that management network from there, or setup a highly secure gateway or VPN that will give you access to that management network.


There is one more place to check your community string. Go to iDrac Settings on the left side. Click on Network/Security tab, and then the Services sub-tab at the top. Scroll down to find SNMP Agent box. Make sure the check box is checked so it is enabled and enter your community string here. Then click the Apply button at the very bottom of the page.


64bit - http://www.dell.com/support/home/us/en/04/Drivers/DriversDetails?driverId=6RWMR
You will also need a text file with all of your iDrac6 IPs, each listed on a separate line.
The next step is to grab a copy of the config of the iDrac that you just set in the above steps. On your machine with access to your iDrac network, and with the DRAC Tools installed, you are going to run the following command from an Administrative level command prompt.
**NOTE**: These racadm commands below are for iDrac6 running 1.99. Different firmware may have different commands that you will need to look up in the iDrac CLI manuals if the below do not work.
racadm -r IPofTheIDrac -u Username -p Password getconfig -f LocationForTxtFile
Replace IPofTheIDrac with the IP of the iDrac you configured above.
Replace Username with your iDrac username.
Replace Password with your iDrac password.
Replace LocationForTxtFile with a path to where you want the configuration text file created. I put the config file in the same location as my iDracs.txt file with all of my iDrac IPs just to keep them together. In this example I put both in a folder c:\idrac.

The other sections we are going to keep are [cfgOobSnmp], [cfgIpmiLan], [cfgIpmiPet] sections. There are 4 cfgIpmiPet sections, each with a different Index, but I only set the first one so I am removing the others. You don't have to keep every setting under each section. Just the settings that we changed in the GUI.
Now save that file, maybe with a different name so that you can keep the original. I'm going to save mine as idrac6push.txt in the same folder.
Here is where we finally push the config to all iDracs. You will use a PowerShell script. Right click on the PowerShell icon on your taskbar and select Run ISE as Administrator. When it opens copy this script into the top window. You will need to replace Username and Password to your own.
$servers = Get-Content .\idracs.txt
$servers | foreach {
invoke-expression "racadm.exe -r $_ -u Username -p Password config -f c:\idrac\idrac6push.txt"
}

When you are ready, click on the green play button in the middle of the tool bar to start the script. The script will set the config on each iDrac one at a time. You will see output for each idrac like in my screenshot above showing those 3 sections we kept in the config file. You can scroll back through the results pane to see if there were any errors.
Congratulations, now all of your iDrac6 devices should have the same SNMP settings.
Subscribe to:
Posts (Atom)